




Short answer: A realistic ice cream shop profit margin per scoop is often 65-80 percent after mix, serving ware, direct labor, electricity, and waste, which can leave $2.90-$3.80 contribution from a $4.50 scoop. The exact figure depends on portion size, mix cost, overrun, labor productivity, and waste. Use your own invoices and sales data, then calculate how many scoops must sell before the machine pays for itself.
The expensive mistake is treating a margin benchmark as a promise. A shop can look healthy with a 78 percent contribution margin and still lose money if it sells 80 scoops a day against $500 of daily fixed costs. Another shop can charge less, keep a thinner margin, and earn more because its machine, menu, and staffing fit a busy commuter window.
This guide is for bakery owners, cafe and bubble tea operators, gelato shop founders, and home bakers moving into commercial production. It builds a per-scoop model, shows the daily break-even count, and connects that number to machine capacity. If you are still comparing equipment categories, start with the commercial ice cream machine buying guide before running the math below.
What Is Ice Cream Shop Profit Margin per Scoop?
Profit per scoop is not just selling price minus mix. It is the money left after every cost that rises when you serve another portion: mix, cone or cup, spoon, direct labor, electricity, and normal waste. That leftover is contribution margin. It pays rent, insurance, marketing, repairs, owner drawings, and the machine itself.
Keep 2 numbers separate. Gross margin usually subtracts only product cost. Contribution margin subtracts all variable costs. If mix costs $0.42 and the cone costs $0.18, the product cost is $0.60, but the contribution cost is higher once you include the labor and utility load created by serving volume.
Use this formula:
- Contribution per scoop = selling price – variable cost per scoop.
- Contribution margin = contribution per scoop divided by selling price.
- Machine payback scoops = installed machine cost divided by contribution per scoop.
A $4.50 scoop with $1.05 of variable cost contributes $3.45. That is a 76.7 percent contribution margin. Remove one ingredient cost and the number improves; add careless portioning or a long queue that needs extra staff and it falls.
How Do You Build a Per-Scoop Cost Table?
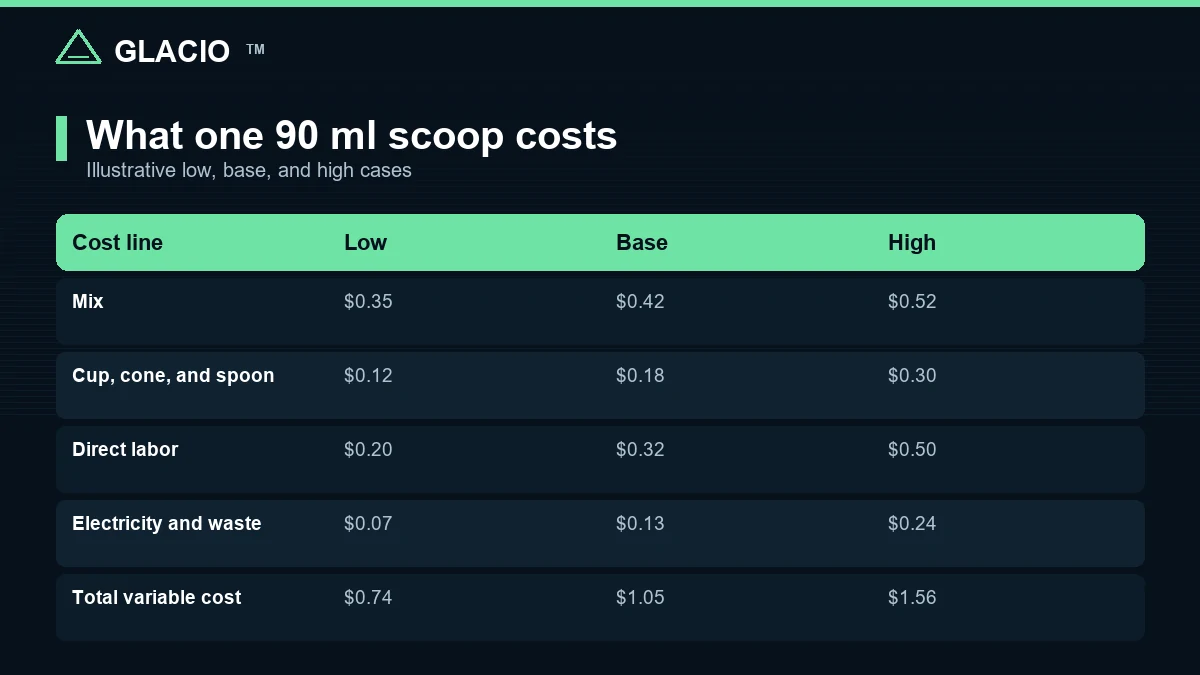
Start with a clear serving definition. This model uses a 90 ml scoop of finished ice cream, about 3 fluid ounces. Mix costs $6 per liter. The base case assumes 30 percent overrun, so the scoop uses about 69 ml of mix. Load mix at 2-4 degrees C; warm mix runs longer, draws soft, and can force repeat cycles.
| Cost line | Low case | Base case | High case |
|---|---|---|---|
| Mix | $0.35 | $0.42 | $0.52 |
| Cone, cup, and spoon | $0.12 | $0.18 | $0.30 |
| Direct labor | $0.20 | $0.32 | $0.50 |
| Electricity | $0.03 | $0.06 | $0.12 |
| Waste allowance | $0.04 | $0.07 | $0.12 |
| Total variable cost | $0.74 | $1.05 | $1.56 |
The labor figure comes from a scenario, not a payroll slogan. At $18 per hour, one worker serving 60 scoops in an hour costs $0.30 per scoop. Serve only 20 scoops in that hour and the same worker costs $0.90 per scoop. The electricity figure can be tested with a meter: if production and display add $6 during an hour when 100 scoops sell, electricity is $0.06 per serving.
At a $4.50 price, the low case leaves $3.76 contribution, the base case leaves $3.45, and the high case leaves $2.94. The difference between low and high is $0.82 per scoop. At 200 scoops a day, that spread is $164 daily, or roughly $5,000 across a 30-day month. Replace every cell with your own invoice, recipe yield, and time study.
What Is Your Break-Even Scoop Count per Day?
Daily break-even is fixed operating cost divided by contribution per scoop. Use fixed costs that do not change with each serving, such as rent, insurance, software, salaried management, and scheduled service. Do not include the machine payment yet if you want to see the shop’s operating break-even first.
| Daily fixed cost | At $3.45 contribution | At $2.94 contribution |
|---|---|---|
| $200 | 58 scoops | 69 scoops |
| $350 | 102 scoops | 120 scoops |
| $500 | 145 scoops | 171 scoops |
A 26-scoop shortfall at $3.45 is $89.70 of contribution lost in one day. Across 30 days, that is $2,691. This is why a small waste increase or a weaker peak can hurt more than owners expect.
Machine payback comes next. Divide the installed quote by contribution per scoop. With $3.45 contribution, an illustrative $10,000 quote needs 2,899 scoops. That is about 29 selling days at 100 scoops a day, or 15 selling days at 200 scoops a day. The dollar amount is an arithmetic example, not a GLACIO price. Put your real quote into the formula.
- Add the machine price, freight, installation, and any electrical work.
- Use conservative contribution, not your best-case scoop.
- Divide total installed cost by contribution per scoop.
- Compare that scoop count with realistic daily sales, not opening-week excitement.
- Add financing cost, maintenance, and downtime before calling the result profit.
For a deeper payback model, use the machine ROI payback guide. It helps separate contribution from accounting profit.
How Do Waste and Overrun Move the Margin?
Overrun is the air incorporated into the mix. It affects yield, texture, portion weight, and the amount of mix used per 90 ml serving. At $6 per liter, a 20 percent overrun scoop uses 75 ml of mix and costs about $0.45. At 30 percent it uses 69 ml and costs about $0.42. At 40 percent it uses 64 ml and costs about $0.39.
The cheaper mix cost is not automatically better. Higher overrun can create a colder, lighter scoop that melts differently and may feel less rich. If customers respond by ordering a second scoop or choosing another shop, saving $0.03 per portion was not a win. Gelato shop margins are especially sensitive to this balance because recipe style and serving expectation already shape the target texture.
Waste moves the number from the other direction. A 6-liter mix load at 30 percent overrun produces about 7.8 liters before loss. At 90 ml per serving, that is about 87 theoretical portions. An 8 percent waste rate leaves about 80 sellable portions.
- 3 percent production loss: mix left in the machine, spillage, scrape-down, and purged batches.
- 3 percent display loss: unsold pans, poor rotation, or product held beyond its best quality window.
- 2 percent service loss: staff tastes, remakes, and customer comps.
If waste rises from 8 percent to 15 percent, sellable portions fall from about 80 to 74 per load. Six fewer servings at $3.45 contribution is $20.70 lost from one batch. Run 3 batches a day and the same gap can exceed $60 daily. Track production, sales, and discards separately; a single “waste” number hides whether the problem is forecasting, portioning, or machine handling.
Why Does Peak-Hour Capacity Cap Profit More Than Price?
A price change affects every scoop, but a capacity shortage affects the highest-value hour. Imagine a shop with 200 daily scoops. Raising price by $0.25 adds $50 if volume holds. Losing 30 customer tickets during a rush at an $8 average check gives up $240 of revenue. The capacity loss is larger, and it also damages future visits when the line looks impossible.
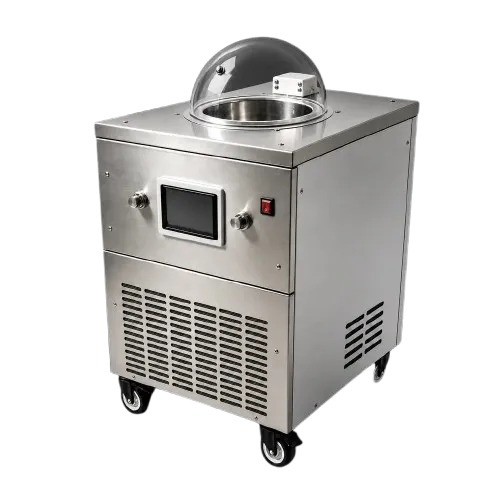
The GLACIO GB-Series uses 1 to 6 six-liter bowls, with a typical cycle of 15-20 minutes per bowl and roughly 14 liters per hour per bowl. Draw temperature, cycle time, and output depend on mix, starting temperature, ambient conditions, and the operating cycle. Treat output as a planning ceiling, not a guarantee.
At 90 ml per serving, 14 liters per hour is about 155 theoretical scoops per bowl. After 8 percent waste, plan for roughly 143 sellable scoops. Two active bowls provide about 286 scoops in the hour, 4 bowls about 572, and 6 bowls about 858. Those numbers matter only if the product is ready before the rush.
- If demand peaks at 250 scoops in one hour, 2 active bowls can cover the ceiling with staged batches.
- If demand peaks at 500 scoops, 2 bowls fall short; 4 bowls provide more room for flavor variety and refill time.
- If demand peaks above 600 scoops, capacity, storage, staffing, and checkout speed all need to be tested together.
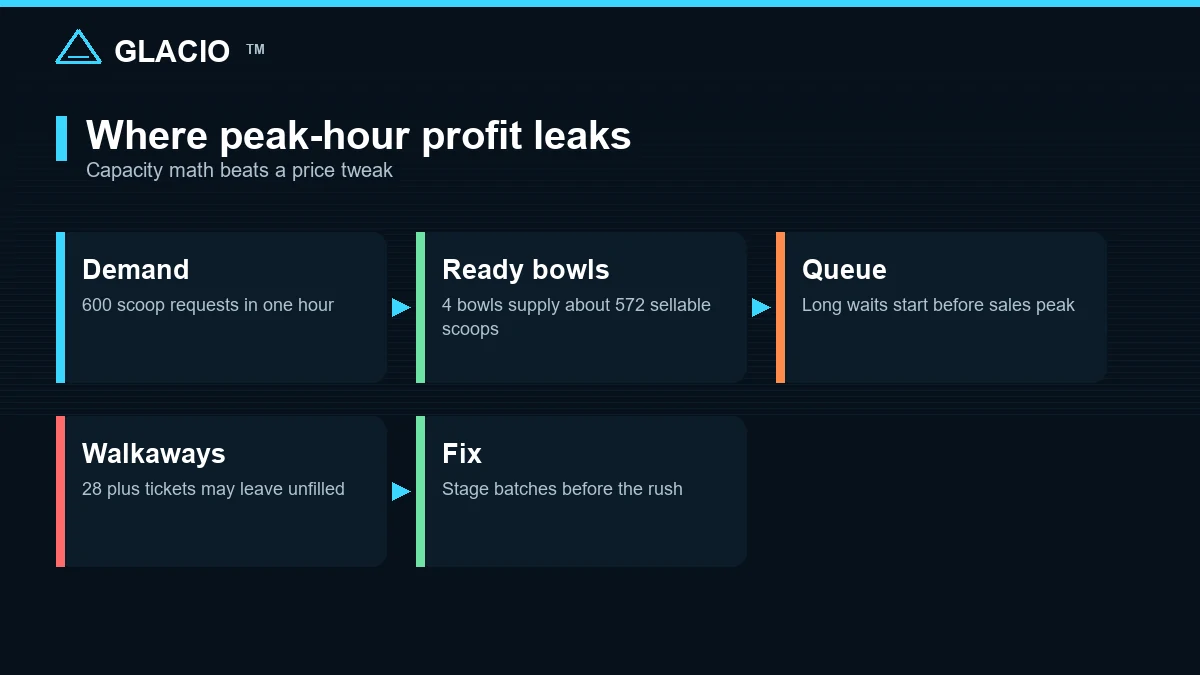
Read the peak-hour capacity guide before you size a machine around total daily liters alone. Daily volume tells you how much to make. Peak demand tells you how many bowls must be ready at once.
How Should You Price a Scoop for a Target Margin?
Work backward from the contribution you need. If variable cost is $1.05 and you want a 70 percent contribution margin, divide $1.05 by 0.30. The required price is $3.50. At $4.50, the same cost keeps $3.45 and produces a 76.7 percent margin.
- Set the target: choose the contribution margin that covers fixed cost and profit.
- Test the menu: price single, double, cone, cup, and toppings separately because serving ware and labor do not scale evenly.
- Check the discount: cutting $0.50 from a $4.50 scoop reduces contribution to $2.95, so the shop needs more volume to earn the same gross contribution.
- Review monthly: update mix, labor, electricity, and waste whenever an invoice or sales pattern changes.
Do not use price to solve a capacity problem. A discount can fill a quiet afternoon, but it cannot help a 7 p.m. line if every bowl is already empty or the machine needs another cycle before the next pan is ready.
Which Machine Actually Fits the Volume?
Choose bowls from the busy window, flavor count, and production rhythm. A machine that looks affordable can become expensive if it forces long waits, limits flavor variety, or cannot recover after a lunch rush.
| Model | Six-liter bowls | Approximate weight | Planning role |
|---|---|---|---|
| GB-1 | 1 | 96 kg | Single-flavor production for a very small operation |
| GB-2 | 2 | 140 kg | Bakery, cafe, or compact shop with modest peaks |
| GB-4 | 4 | 230 kg | Gelato shop serving several flavors through busy periods |
| GB-6 | 6 | 330 kg | High-volume shop with tight peak-hour demand |
Use the batch freezer sizing by daily sales method after this profit model. If your peak is 350 scoops and 1 bowl offers about 143 sellable scoops an hour after waste, 1 bowl is not enough unless customers wait across multiple cycles. A 4-bowl GB-4 provides more capacity and flavor choice, but it also weighs about 230 kg and needs space, power, drainage, and ventilation planned before delivery.
The GB-Series is designed as front-counter display style hard ice cream and gelato batch freezers. That placement can help sales, but it also means the machine is part of the customer experience. A quiet, clean, well-staged counter supports the price you need. A messy station with empty pans makes even a good margin hard to defend.
Frequently asked questions
What is a realistic ice cream shop profit margin per scoop?
A useful planning range for an ice cream shop profit margin per scoop is 65-80 percent after variable costs. In the worked example, a $4.50 scoop with $1.05 of variable cost leaves $3.45, or 76.7 percent. Your number changes with portion size, mix cost, labor productivity, overrun, and waste.
How much does one scoop cost to make?
The base scenario costs $1.05 per 90 ml scoop after mix, serving ware, direct labor, electricity, and waste. Mix is often the largest ingredient cost, but labor can become larger when volume is low. A shop serving 20 scoops per labor hour carries a very different cost from one serving 60.
How many scoops per day do I need to break even?
Divide daily fixed operating cost by contribution per scoop. At $350 of fixed cost and $3.45 contribution, you need about 102 scoops a day. Add the machine payment separately if you are testing full payback rather than shop break-even.
Does a bigger machine automatically improve margin?
No. More bowls can protect peak sales and reduce lost tickets, but they also add purchase cost, weight, installation needs, and possibly energy use. Buy capacity for the busy hour and the flavor lineup, then verify that daily sales can support it.
How does overrun change gelato shop margins?
Overrun changes both yield and the amount of mix used per 90 ml serving. At $6 per liter, a 20 percent overrun scoop costs about $0.45 for mix, while 40 percent costs about $0.39. The texture, melt, and customer response must justify chasing the lower cost.
How often should I review ice cream cost per serving?
Review it monthly and whenever mix, portion size, labor rate, electricity, or waste changes. Audit waste weekly so one bad flavor, oversized scoop, or poor batch plan does not hide inside an average. A cost model is only useful when the inputs match current operations.
Before You Buy: Match Machine, Menu, and Peak
Build the scoop model first, then buy capacity. Protect at least $3.00 of contribution per scoop in a normal operating case, measure your busiest 30 minutes, and choose the number of bowls that can keep the display stocked without turning customers into a queue. The GLACIO GB-Series gives you 1 to 6 six-liter bowls to match that plan, from a compact 96 kg GB-1 to a 330 kg GB-6 for heavy peak demand.
Bring your mix cost, scoop size, daily fixed cost, and peak-hour scoop count to the conversation. Request a machine recommendation and quote so the equipment choice follows the profit math you just built.
What is your busiest 30-minute scoop count, and does your current machine keep the display ready through it?
Some information may be outdated
Comments
Questions about equipment capacity, voltage, or recipes? Leave a comment.
Loading comments...