




Every few months someone asks us for “the customs data on ice cream machines” and expects a clean answer: X thousand units, Y million dollars, Z destination countries. That number does not exist, and it is worth knowing why before you pay for a trade data subscription.
What does exist is HS 841869 — “other refrigerating or freezing equipment” — a category that also holds industrial water chillers, drinking water coolers, ice makers and heat pumps. Hard ice cream machines and gelato batch freezers live inside it, but they cannot be separated at the six-digit level.
This article works through the actual figures from UN Comtrade, Eurostat and the US tariff database, and explains what they can and cannot tell you when you are buying, importing or distributing hard ice cream equipment.
There is no “ice cream machine” customs code
The most transparent classification system is the US Harmonized Tariff Schedule, and it is blunt about this. Under 8418.69.01, the statistical suffixes are:
| US statistical code | Official description |
|---|---|
| 8418.69.01.10 | Icemaking machines |
| 8418.69.01.20 | Drinking water coolers, self-contained |
| 8418.69.01.30 | Soda fountain and beer dispensing equipment |
| 8418.69.01.40 | Centrifugal liquid chilling refrigerating units |
| 8418.69.01.50 | Reciprocating liquid chilling refrigerating units |
| 8418.69.01.60 | Absorption liquid chilling units |
| 8418.69.01.80 | Other refrigerating or freezing equipment |
Search the word “ice cream” across the whole of chapter 84 and you get nothing. A commercial hard ice cream machine is declared as 8418.69.01.80, “other” — sitting in the same bucket as laboratory baths and industrial process coolers. In the European Union the equivalent line is CN 8418 69 00, described by Eurostat as “refrigerating or freezing equipment (excluding refrigerating and freezing furniture)”.
A smaller share of machines — mostly inline industrial units — is classified under 8438.80, “other machinery for the industrial preparation or manufacture of food or drink”. China exported $508.8m of that line in 2024, an order of magnitude smaller than 841869.
Two practical consequences follow. First, any figure claiming a precise unit count for ice cream machine imports has been filtered from bill-of-lading text, not from a tariff code. Second, if you are comparing suppliers or writing a business plan, treat HS 841869 as the ceiling of the market, not the market itself.
How large the trade actually is
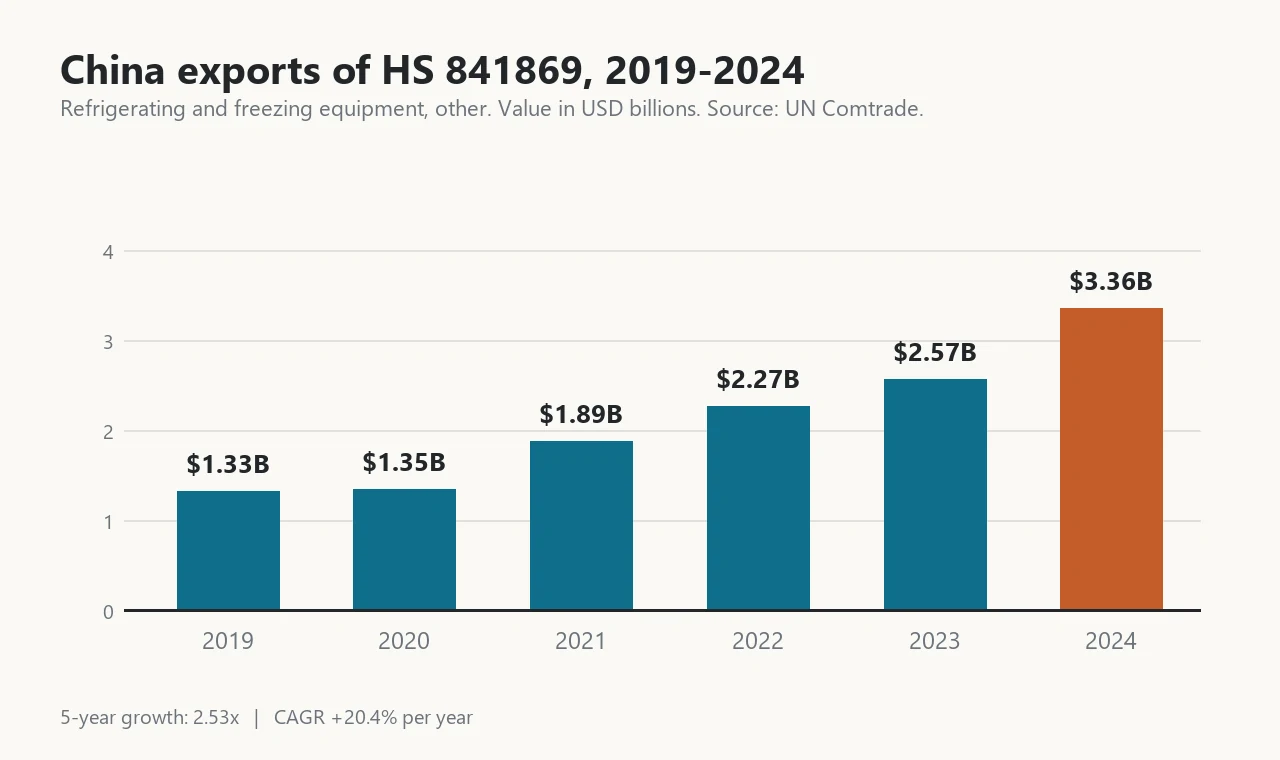
Chinese exports of HS 841869, from UN Comtrade annual submissions:
| Year | Export value (USD) | Net weight (kg) | Unit value |
|---|---|---|---|
| 2019 | 1,325,718,344 | 143,513,519 | $9.24/kg |
| 2020 | 1,345,895,634 | 149,604,579 | $9.00/kg |
| 2021 | 1,884,601,226 | 194,815,366 | $9.67/kg |
| 2022 | 2,273,049,552 | 212,803,688 | $10.68/kg |
| 2023 | 2,573,965,827 | 252,095,725 | $10.21/kg |
| 2024 | 3,356,246,431 | 344,128,174 | $9.75/kg |
Five-year growth is 2.53x, a compound rate of 20.4% a year. Weight grew slightly faster than value, which tells you the mix moved toward lower-priced equipment — consistent with what most buyers see in the market.
One caution when reading 2025 numbers: a large part of the recent growth in this tariff line is liquid chilling units for data centre cooling, not food equipment. When US imports of HS 841869 jumped 34% between 2024 and 2025, the driving statistical codes were the centrifugal and reciprocating chiller lines, not the ice and food equipment lines. Do not read a headline growth figure for this code as ice cream demand.
Which countries buy the machines
Largest destinations for Chinese exports of HS 841869 in 2024, with two-year growth:
| Market | 2024 imports from China | Share of Chinese exports | 2022 value | Change |
|---|---|---|---|---|
| United States | 778,935,559 | 23.2% | 419,397,125 | +86% |
| Malaysia | 160,664,922 | 4.8% | 92,066,501 | +75% |
| Indonesia | 143,823,040 | 4.3% | 108,218,530 | +33% |
| Vietnam | 143,783,228 | 4.3% | 110,896,895 | +30% |
| Thailand | 141,599,597 | 4.2% | 99,004,565 | +43% |
| India | 132,480,123 | 4.0% | 93,005,218 | +42% |
| Russia | 119,388,873 | 3.6% | 49,470,484 | +141% |
| Australia | 99,120,124 | 3.0% | 74,523,409 | +33% |
| United Arab Emirates | 89,911,897 | 2.7% | 44,806,448 | +101% |
| Mexico | 83,803,835 | 2.5% | 32,958,011 | +154% |
| Saudi Arabia | 79,560,993 | 2.4% | 41,952,379 | +90% |
| Singapore | 79,346,112 | 2.4% | 73,380,310 | +8% |
| Japan | 76,753,190 | 2.3% | 90,228,764 | -15% |
| Philippines | 74,288,193 | 2.2% | 55,684,826 | +33% |
| South Korea | 68,777,040 | 2.1% | 58,652,383 | +17% |
| Brazil | 66,622,920 | 2.0% | 28,374,873 | +135% |
| Germany | 52,802,951 | 1.6% | 53,656,619 | -2% |
| Netherlands | 40,804,019 | 1.2% | 43,388,391 | -6% |
| Canada | 39,310,644 | 1.2% | 24,162,362 | +63% |
| United Kingdom | 34,241,343 | 1.0% | 31,146,915 | +10% |
The pattern matters more than the ranking. The United States alone takes 23% of Chinese exports in this line and doubled in two years. The four large Southeast Asian markets together take roughly 18%. The fastest movers are Mexico (+154%), Russia (+141%), Brazil (+135%) and the UAE (+101%). Japan is the one large market moving the other way, down 15%.
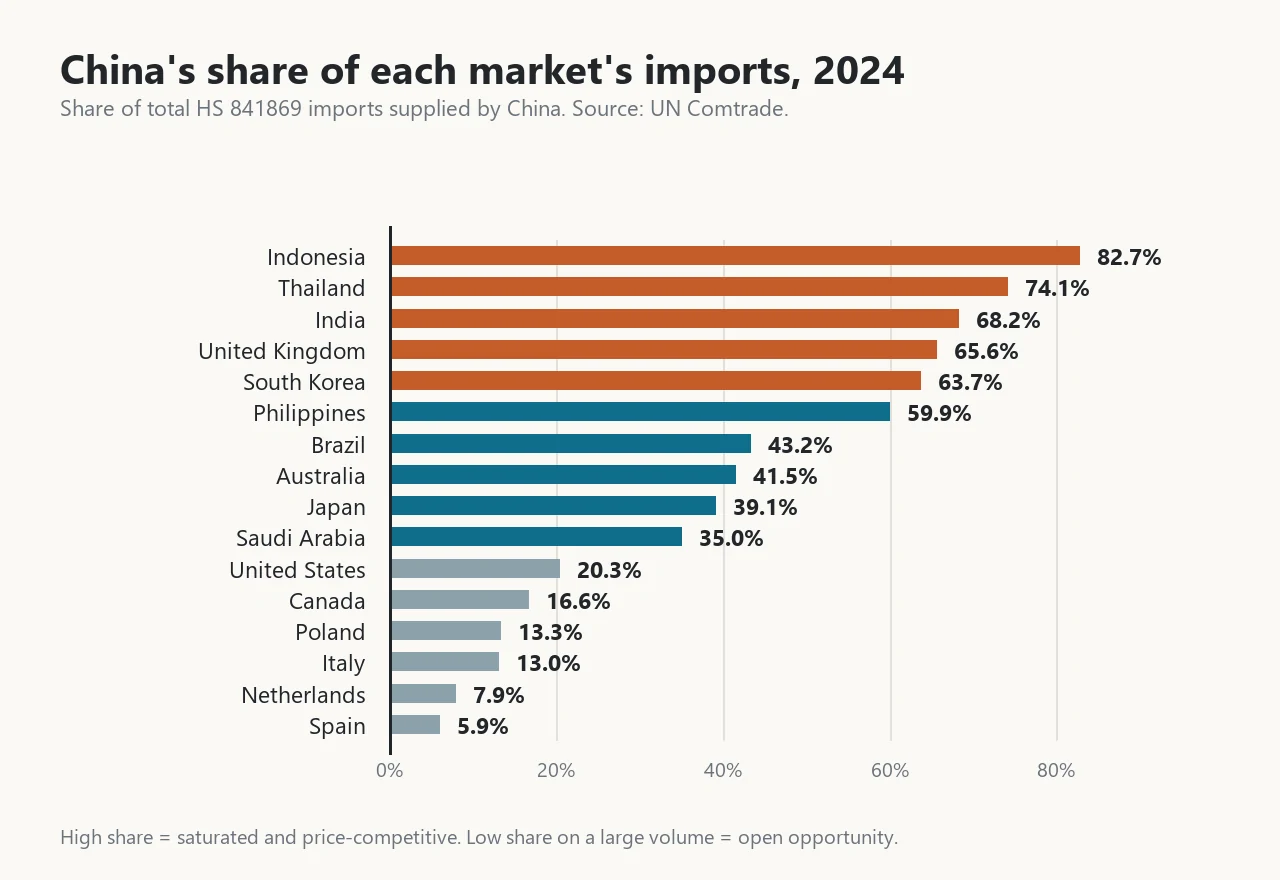
Cross-referencing those flows against what each country reports importing gives a clearer picture of openness. In 2024 China supplied 82.7% of Indonesia’s imports in this line, 74.1% of Thailand’s and 68.2% of India’s — markets where the fight is between Chinese suppliers. At the other end, China supplied only 7.9% of the Netherlands’ imports, 5.9% of Spain’s and 13.0% of Italy’s. Those are large, high-priced markets still dominated by European manufacturers and intra-EU trade.
What the machines actually sell for
| Exporting country | 2024 export value | Net weight | Unit value |
|---|---|---|---|
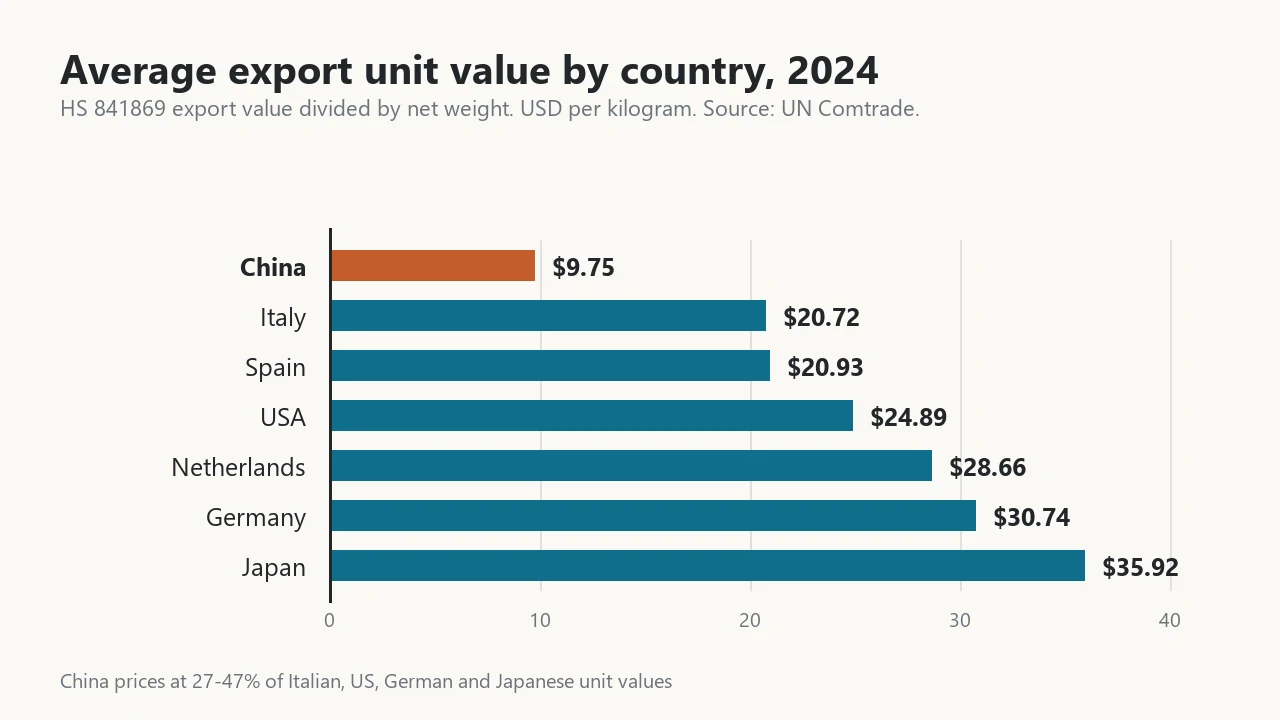
| China | 3,356,246,431 | 344,128,174 kg | $9.75/kg |
| United States | 1,469,486,302 | 59,035,367 kg | $24.89/kg |
| Italy | 1,345,936,224 | 64,967,300 kg | $20.72/kg |
| Germany | 844,761,845 | 27,484,823 kg | $30.74/kg |
| Netherlands | 245,522,252 | 8,566,027 kg | $28.66/kg |
| Japan | 171,864,527 | 4,785,041 kg | $35.92/kg |
| Spain | 66,510,154 | 3,178,172 kg | $20.93/kg |
Unit value per kilogram is not a price list — it mixes machines with spare parts and accessories — but the spread is too large to be explained by mix alone. Chinese equipment leaves the country at 47% of the Italian and US rate and 27% of the Japanese rate.
That gap is the single most useful number in this article, because it explains two things buyers run into constantly. It explains why Chinese machines can be quoted at a fraction of European pricing, and it explains why a machine built to European specification — thicker panels, larger compressor, stainless throughout, longer warranty — cannot be sold at a Chinese average price and still make money. When two suppliers quote prices that differ by 3x for a “60 litre batch freezer”, they are generally not quoting the same machine.
Europe in detail
Eurostat publishes the EU side of this trade at CN8 level, which is cleaner than the global data. Total EU-27 imports of CN 8418 69 00:
| Year | EU-27 imports (EUR) | Of which intra-EU | Of which extra-EU |
|---|---|---|---|
| 2020 | 1,998,296,250 | — | — |
| 2024 | 2,987,189,780 | 2,253,830,405 | 733,359,375 |
| 2025 | 3,220,460,661 | 2,474,016,974 | 746,443,687 |
Roughly three quarters of EU imports in this line are internal EU trade — mostly Italian and German machines moving to neighbouring markets. Of the external imports, China supplied 42.1% in 2024 and 44.6% in 2025, more than four times the next supplier, the United States.
Member state totals for 2025 show where the volume sits: Germany EUR 852.9m, France EUR 376.8m, the Netherlands EUR 272.9m, Spain EUR 244.5m, Italy EUR 222.7m, Belgium EUR 183.3m and Poland EUR 165.5m. Growth since 2020 has been fastest in Bulgaria (+230%), Ireland (+126%), Croatia (+123%), Italy (+117%) and Portugal (+109%).
The EU also exports heavily: EUR 2.14bn outside the bloc in 2024, led by the UK (EUR 345.9m), the United States (EUR 212.6m), Switzerland, Saudi Arabia, Turkey and the UAE. The Gulf is where European and Chinese equipment compete most directly, which is why it is worth watching price movement there.
The 2025 shift you should know about
Where reporting for 2025 is already available, one change stands out. US imports of HS 841869 rose to $3.76bn, but the share supplied by China fell from 20.3% in 2024 to 13.6% in 2025. The absolute value of Chinese-origin imports also fell, from $570m to $510m.
Other markets moved the other way. Japan’s imports from China rose to 41.6% of its total, Brazil’s to 50.6%, Saudi Arabia’s to 39.2%. So the picture is not “China is losing everywhere” — it is sourcing being reorganised, with the United States pulling back and other regions deepening their reliance.
For a buyer, that has a concrete implication: if you are importing into the United States, the delivered cost of a Chinese machine now carries a tariff load that did not exist in 2019, and some suppliers are routing through third countries to manage it. Ask any supplier to state country of origin in writing, and check that the declared origin matches where the machine was actually assembled, because customs authorities in both the US and EU are actively auditing this.
What to do with this information
If you are buying one machine for a shop, use the unit values as a sanity check rather than a price list. A quote far below the origin-country average means either a smaller machine, thinner build, or lower-spec components. Ask for the compressor brand, cylinder volume, refrigerant type and the actual net weight — then compare on specification, not on the number on the invoice.
If you are importing or distributing, the opportunity map is fairly clear. High-share markets such as Indonesia, Thailand, India and the Philippines are crowded with Chinese suppliers and compete mainly on price. Markets with a large import base and low Chinese share — the Netherlands, Spain, Italy, Poland and Canada — are the ones where an import programme still has room, provided you match European certification and after-sales expectations.
If you are planning production capacity, match the machine to your real throughput rather than the biggest number on the brochure. A batch freezer sized for peak Saturday demand sits idle five days a week and costs the same to buy either way.
How to check these figures yourself
All of the numbers above come from free official sources. You can verify or refresh them without a subscription:
- UN Comtrade — annual trade by HS code. Query
https://comtradeapi.un.org/public/v1/preview/C/A/HS?reporterCode=156&period=2024&cmdCode=841869&flowCode=X. Reporter 156 is China, 842 the United States, 380 Italy, 276 Germany, 699 India, 392 Japan. Flow X is exports, M imports. - Eurostat Comext — EU trade at CN8 level, including the intra-EU and extra-EU split, through dataset DS-045409.
- USITC HTS — the authoritative US code list, searchable at
https://hts.usitc.gov/reststop/search?keyword=8418.69. - US Census Bureau international trade API — the only free source that separates the ten-digit statistical suffixes, so it is the only way to isolate icemaking and dispensing equipment from liquid chillers.
For company-level data — who imported what, from whom, and when — you need bill of lading records rather than customs statistics. ImportYeti covers US ocean shipments with a free tier, Volza and Zauba have free preview pages, and Panjiva is the paid standard. Search by product keywords (“batch freezer”, “gelato machine”, “ice cream machine”, “pasteuriser”) and aggregate by consignee; companies that appear three or more times a year are distributors and chains worth contacting, not one-off buyers.
Frequently asked questions
What HS code is a commercial ice cream machine?
Most commercial hard ice cream machines and gelato batch freezers are declared under HS 841869 — “other refrigerating or freezing equipment”. In the United States that is statistical line 8418.69.01.80; in the EU it is CN 8418 69 00. There is no dedicated ice cream machine code in either system, and a smaller number of industrial inline units are classified under 8438.80.
How big is the commercial ice cream machine market?
No customs authority publishes that figure directly, because the machines share a tariff line with chillers, water coolers and ice makers. The tariff line itself is large: China exported $3.36bn of HS 841869 in 2024, and the EU imported EUR 3.22bn of CN 8418 69 00 in 2025. Food service and ice equipment is a minority share of those totals.
Which country exports the most ice cream machines?
China, by a wide margin. In 2024 China exported $3.36bn of HS 841869 against $1.47bn for the United States, $1.35bn for Italy and $0.84bn for Germany. On weight, China shipped 344,000 tonnes, roughly five times the Italian total.
Why are Chinese ice cream machines cheaper?
China’s average export unit value for this tariff line was $9.75/kg in 2024, against $20.72/kg for Italy, $24.89/kg for the United States and $35.92/kg for Japan. Some of that gap is lower labour and component cost; some reflects thinner specification, smaller compressors and shorter warranty terms. When comparing quotes, ask for compressor brand, cylinder volume, refrigerant, net weight and warranty length — those five answers explain most of the price difference.
How can I find out who imports ice cream machines into my country?
Use bill of lading data rather than customs statistics. ImportYeti provides US ocean import records with a free tier; Zauba covers India; Volza and Panjiva cover a much wider set of countries on paid plans. Filter by product keyword, group by consignee, and prioritise companies with repeat shipments.
Does the customs data show how many units were shipped?
China reports a unit count alongside weight for HS 841869 — 14.4 million units in 2024 — but the figure covers the entire category, including water coolers and small refrigeration equipment, so it cannot be read as an ice cream machine count.
Method and sources
Figures in this article are taken from official submissions, not estimates. Export and import values come from UN Comtrade annual HS data for 2019 to 2025, queried at six-digit level; European figures come from Eurostat dataset DS-045409 at CN8 level; US tariff descriptions come from the USITC Harmonized Tariff Schedule database. Where a reporter’s submission was clearly incomplete — Germany’s 2024 UN Comtrade figure, and several countries’ 2025 partner detail — the Eurostat figure or the prior year is used and noted in the text.
If you are planning a purchase and want the specification side of the comparison rather than the trade side, our commercial ice cream machine buying guide covers cylinder sizes, compressor selection and the questions to ask before you commit.
Some information may be outdated
Comments
Questions about equipment capacity, voltage, or recipes? Leave a comment.
Loading comments...